Trubadour
The idea for Trubadour, the startup I founded for curation for contemporary poems online, began while I was pursuing my MFA in creative writing at Purdue University. It was challenging to know where to submit my work from the 3,000+ literary venues in North America, and despite this variety, I noticed how insular the poetry community was and a corresponding opportunity to build tools to aid readers in finding the type of poetry specific to one's tastes. The goal for Trubadour was similar to that of Spotify and Pandora for music discovery: help artists reach new audiences by developing a methodology for poetry analysis and a modern platform for reading and sharing. Along the 2-year journey, I wrote articles in a Medium publication about matters related to poetry, poetry discovery, and working on this challenge in a startup setting.
Bardle
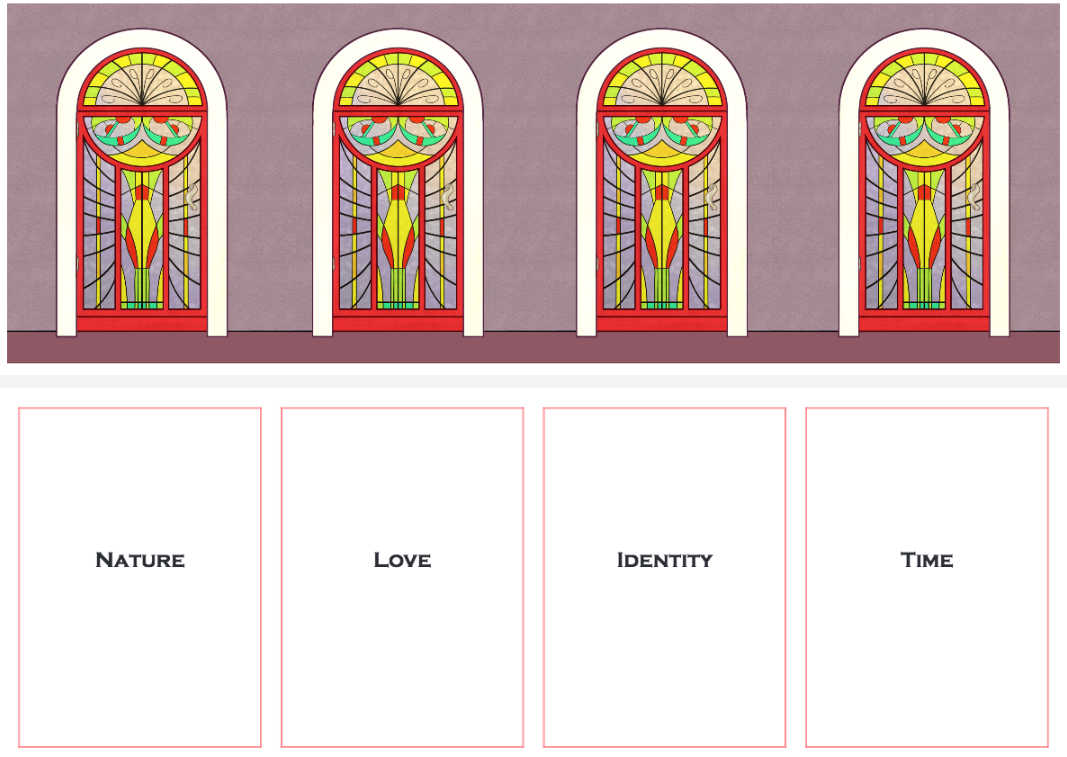
In May 2018, I led a team of two students in Northeastern's game design program to develop a poetry card game called Bardle. Similar to "Apples to Apples", Bardle makes it fun to talk about poetry, meaning, form, and craft/ techniques. We tested with game collectives, meetup groups, and several middle and high school English classes around Boston. We even showcased at the MIT Festival of Indie Games in September 2018! I was so excited that Bardle gave others an opportunity to see poetry as something alive, vibrant, and fun-- a way to foster community and connection with each other while also improving learning outcomes.
Lightning-fast intro to Data Visualization
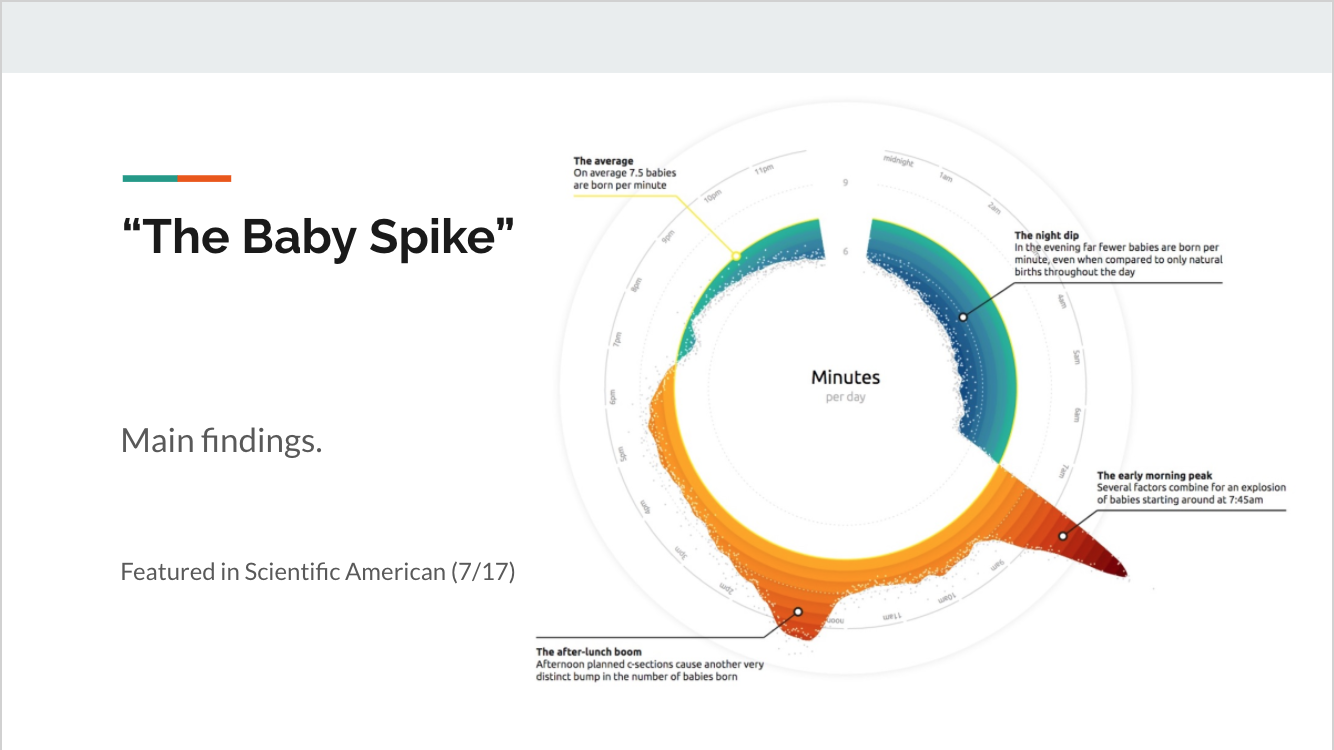
In spring 2019, I took a course called "The Art and Design of Information" at the Harvard Extension School. It was my first introduction to data visualization, and I was hooked! The course opened my eyes to how datavis is both an art and a science, requiring precision and judgement, creativity to invent custom visual models, rigorous analysis, and a deep commitment to finding insights in large datasets and communicating those messages effectively. It showed me the power of distilling complexity in a way that is clear and exciting to understand. I developed this presentation, a 5-minute introduction to datavis, to deliver as a lightning talk at Ada in spring 2020.
E-79 Final project: "Global Water Footprints"
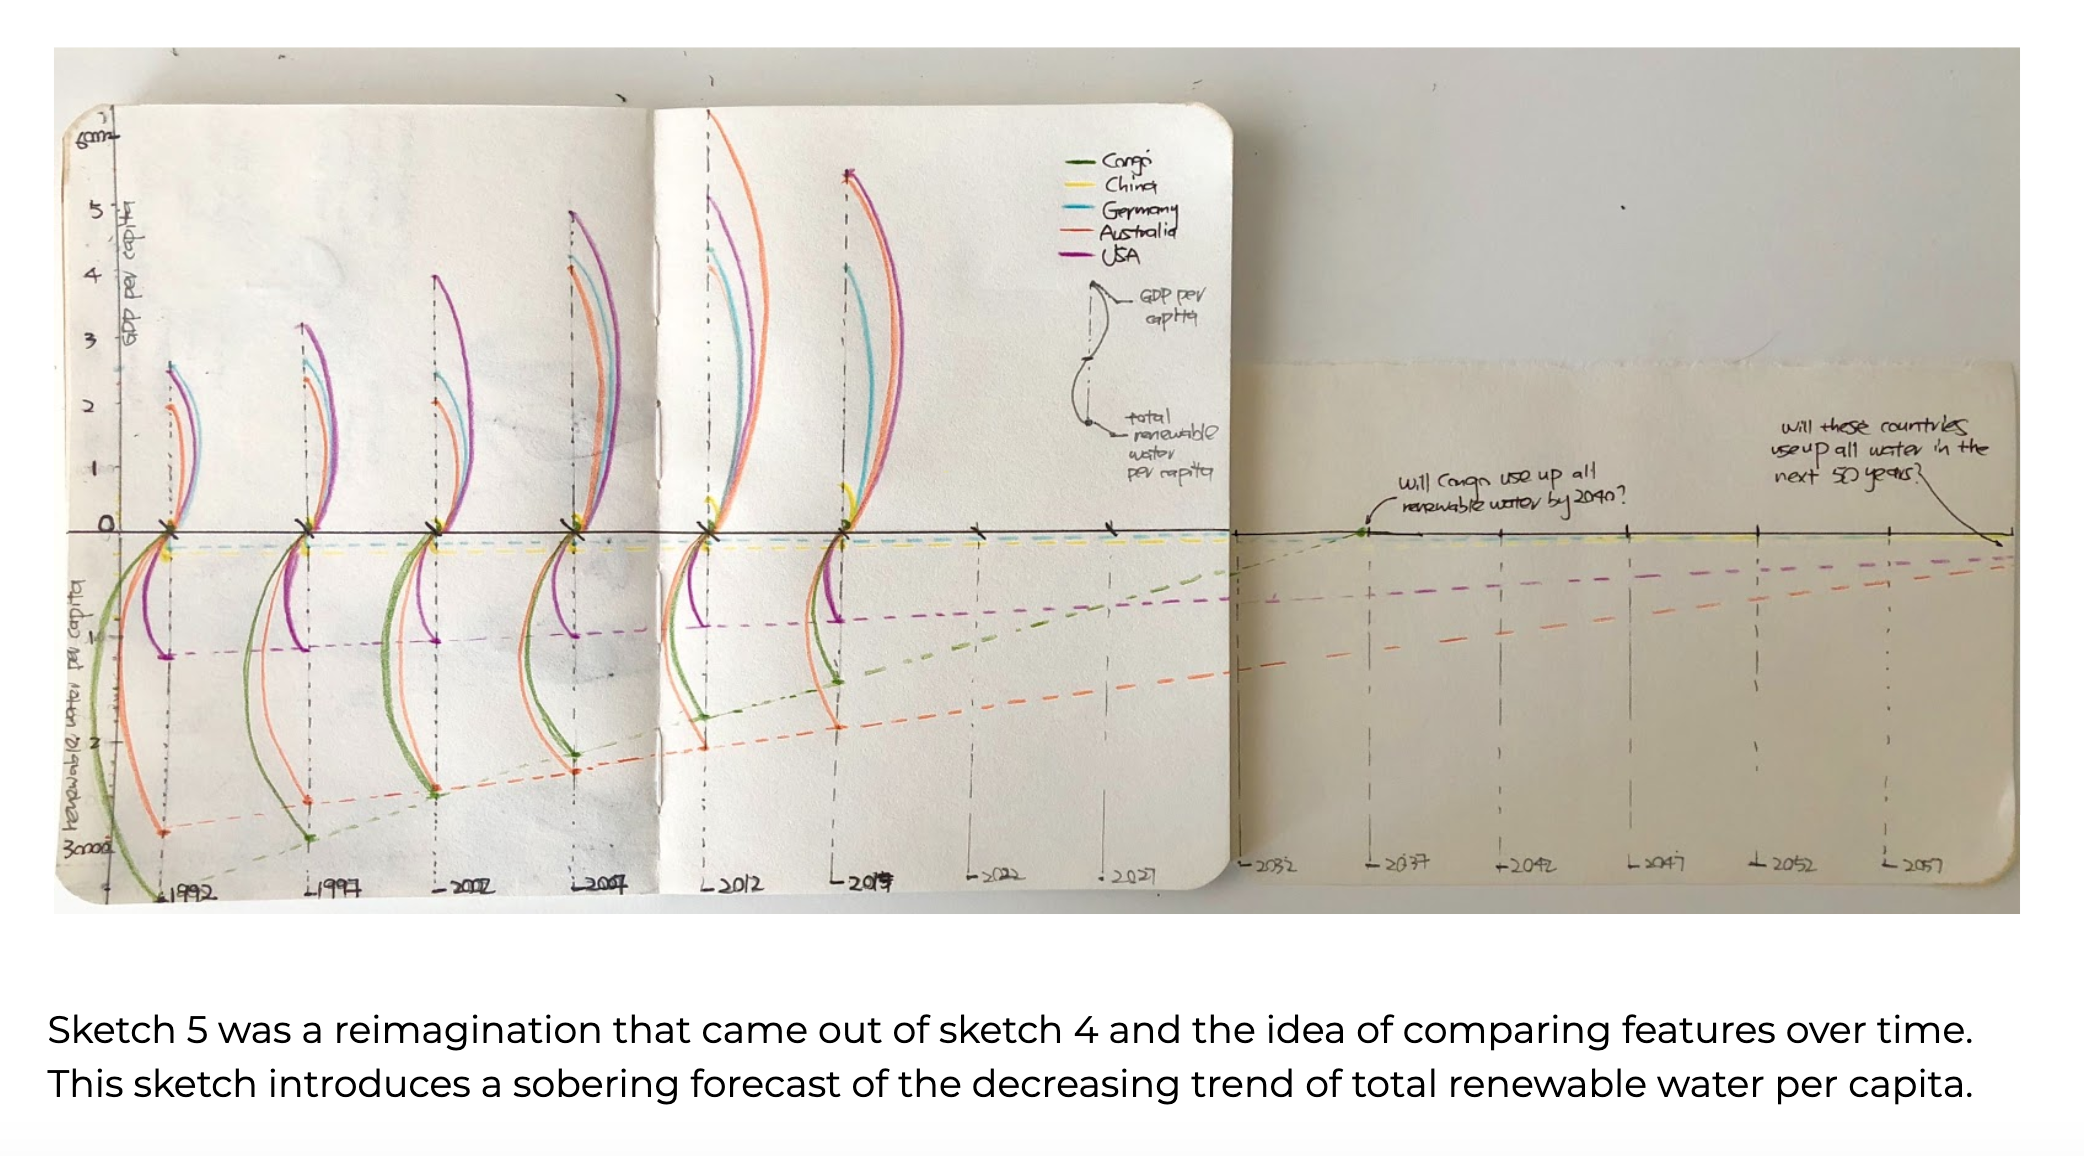
For our final E-79 project, my group decided to research the world's water resources and create a website to present our custom data visualizations on this topic. This process book traces our project from start to finish. Exploring data from the UN’s FAO Aquastat and Hoekstra et al revealed that the US carries one of the highest water consumption footprints per capita in the world; that of all sectors, agriculture places steep demands on available water resources; and that the pace of global water consumption is outstripping the earth's natural timescale for replenishing them.